Alarm.com energy management is about tracking your real-time usage and providing you a convenient system and user interface to monitor and improve your energy consumption. Here are a few screenshots that might help get the idea across.

The dashboard is a quick snapshot of the energy usage of your household. Hover over parts of the Energy Wheel for more information about the total energy used, the projected energy usage and energy goal this month. Keep your tree alive by keeping projected energy usage under the goal for the billing period. The Dashboard also has a summary of your current usage pattern compared to your neighbors as well as the previous billing period.
For solar customers, the Dashboard also shows a summary of the performance of your solar panels.
The information on your dashboard is dependent on your billing period settings. The billing period it is using can be found at the bottom of the page. Adjustments to this can be made on the Settings & Bill Information tab.

This page allows you to view information about your property’s energy usage supplied by the energy meters in your home. Select the device you would like to learn more about from the drop down in the upper left hand corner.
If you select an energy meter with sub-meters then information on those sub-meters may also be shown. To hide information on those sub-meters click again on the check box next to the meter you originally selected. Sub-meters are meters whose energy consumption is already included in another meter’s measurement. A typical example of a meter and its sub-meter is a whole-home meter and a single wall plug meter. Sub-meters can be set up on the Settings & Bill Information tab.
As a general note, you can toggle between viewing your energy consumption in dollars and viewing it in energy by clicking the icons. All bars in the “Dollar View” include any fixed costs that are a part of your energy bill.
The energy costs (represented as dollar amounts) shown on the website and mobile apps are estimates calculated using publicly available rate information from electricity providers. Based on the information you entered in the Settings & Bill Information section about your electricity provider, rate plan, and billing period, combined with the energy consumption data reported by your devices, we are able to estimate how much the energy you use will cost. Sometimes, your electricity provider will base your bill on estimated usage for the billing period, rather than actual measured usage, and they will later adjust your bill when a measurement is available. This can result in a discrepancy between the energy cost estimates shown here and your energy bill. You may also see a difference between the estimates here and your bill if your energy reporting devices go offline or otherwise fail to report energy consumed on a regular basis.
Usage shows the energy consumed by all your energy metering devices over different timeframes. Placing your mouse over a bar displays additional information about the energy you used then. To zoom in on a timeframe click one of the bars.
Select the timeframe shown by clicking the links at the top of the screen. Choosing 24h displays a view showing 24 individual hour long readings, 7d displays 7 individual day long readings, and so on. Views can also be configured to fit billing cycle. Please check the billing cycle box if you would like to do so.
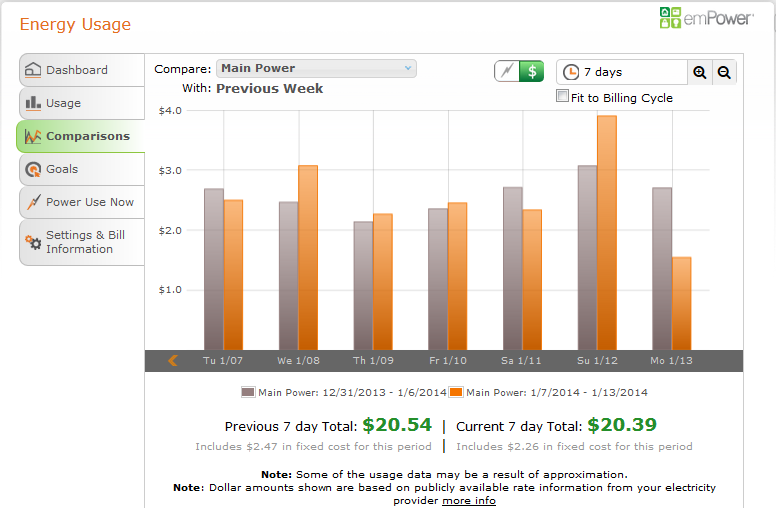
Comparison can be done by time or by meter. Comparison by time allows for one meter’s energy usage during a period to be compared to its energy usage in the previous period. This indicates any changes in the usage behavior patterns over time. You can easily catch any increases in the energy usage.
Comparison by meter allows for comparison between two different meters over the same timeframe. This highlights the low hanging fruit in terms of energy savings.
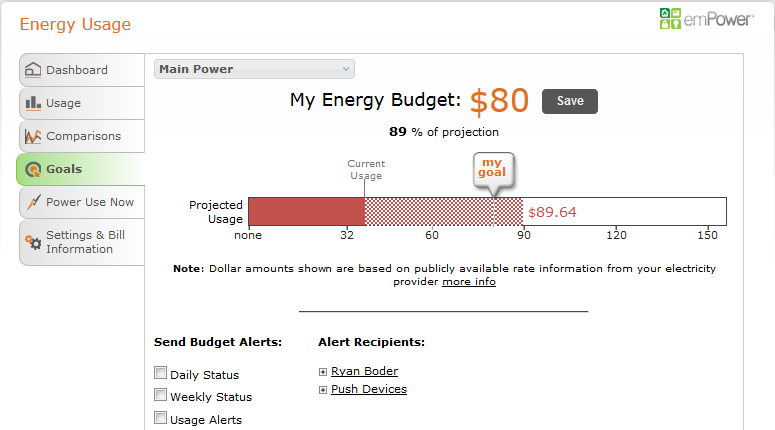
The Goals screen shows the amount of energy your selected meter is expected to consume this billing period, the amount it has consumed so far this billing period, the energy your selected meter consumed last month, and finally the amount it consumes in an average billing period. Information on the last month and an average billing period will not be shown until enough data has been collected. Based on that information you can click and drag the slider towards the top of the page to set an Energy Budget for the month. When you are comfortable with your budget click “Save” in the bottom right hand corner. This will display your Energy Budget when viewing “Usage” and “Comparisons”.
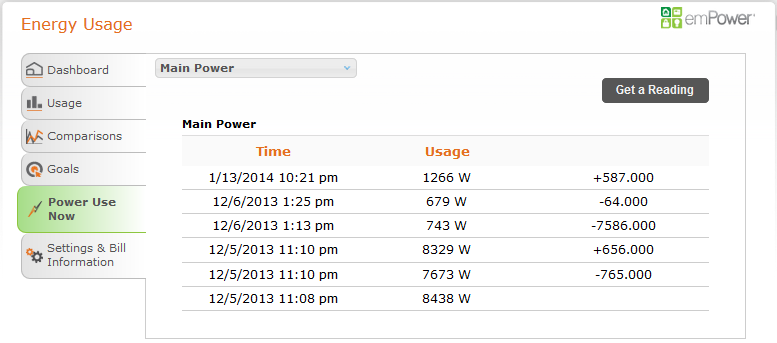
Clicking the “Get a Reading” button in the upper right hand corner requests an instantaneous reading from each selected device of the exact power draw on it. These readings can be compared to past readings, allowing you to know whether devices are currently drawing more or less power than usual.